Development of a Pesticide Spraying Station for Integration with the ANTRAC UGV
Three tank paths, ten nozzles, one command. A fork of ANTRAC 1.0 that replaces broadcast spraying with a dose-controlled station. Dose is bounded by two rails, 180 mL and 560 mL: the reference canopy landed on the floor and sprayed for 14.3 s. At the 560 mL cap, two catch tests delivered 87.7% to 91.6% of the commanded volume.
ANTRAC could detect anthracnose; what it could not do was act on that detection. A sprayer that doses by area, not by plant, cannot use a detection result. If the robot knows that one canopy is infected and the next is healthy, the dose has to be addressable: this plant, this volume, now, while the vehicle keeps moving.
That turns into plumbing and timing. Three tank paths feed a ten-nozzle boom, so a per-plant command selects a fluid line and a valve state, not just switching a pump. The station runs from a 12 V 10 A power supply: pump, three normally-closed solenoid valves, and the relay bank sit on that rail, while the ESP32 only sees the logic side through an LM2596 DC-DC converter. The hydraulic path is open-loop, so delivery shortfall is expected. The boom is 3 m and covers 550 mm (one planting row); a 100 to 125 cm bed carrying two rows requires two passes. The link to the vehicle must also survive the operator walking away, which is what the range test validated.
ESP32 firmware in ESP-IDF and Arduino Core, the WebSocket command interface, canopy-to-volume dose calculation, the power and valve wiring, and bench validation against dashboard payloads.
Vehicle chassis and drive, the YOLOv8 detection model, the operator dashboard, and the agronomy input. Built in the earlier research title, not re-done here.
ESP32 module, an 8-channel relay board, a DC pump set, three 12 V normally-closed solenoid valves, an LM2596 DC-DC converter, and a beaker for the ten-cycle catch test.
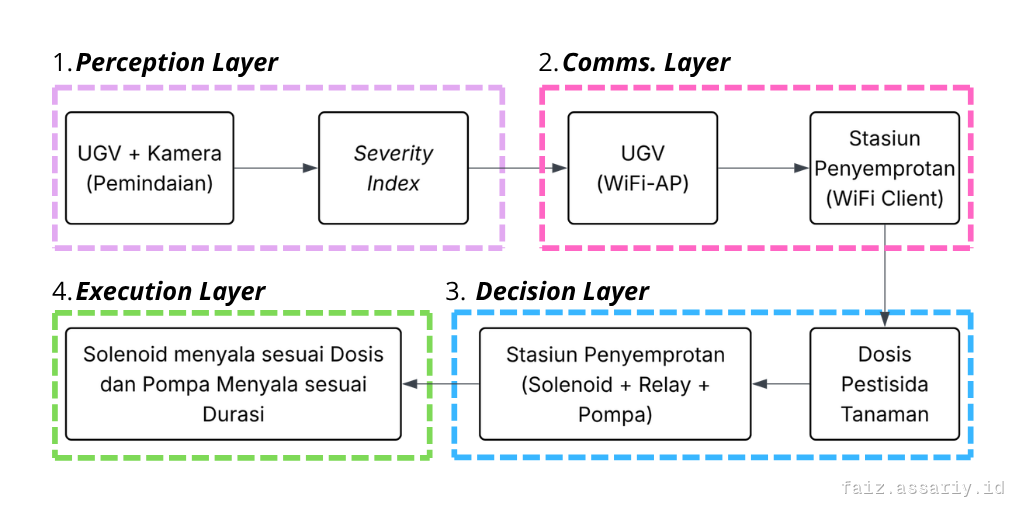
The diagram is the thesis original, labelled in Indonesian. In English: the UGV camera produces a severity index, sends it over Wi-Fi to the station, the station converts it into a dose, and the solenoid and pump run for that dose and duration. Relays switch the pump and valve lines, so the ESP32 only ever sees the logic side. That separation is what fixed the link drops when the pump started.
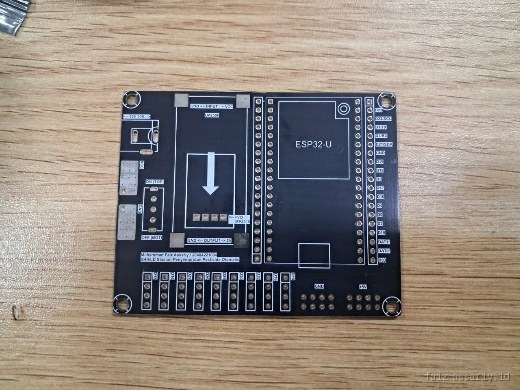
A custom ESP32 shield instead of a breadboard: sensor headers, relay outputs and the power section on one board, because it had to be repaired by hand afterwards, not rebuilt.
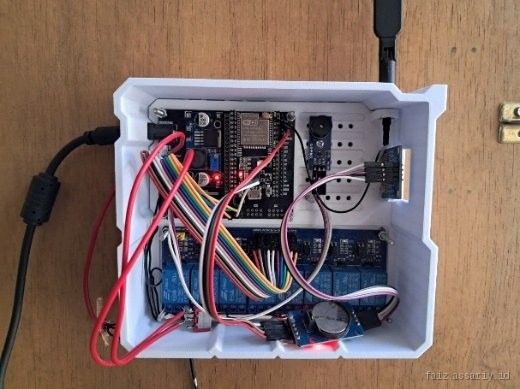
ESP32, the 8-channel relay bank, the DS3231 clock and the OLED mounted on standoffs in one enclosure, with the pump and valve lines on the relay side only.
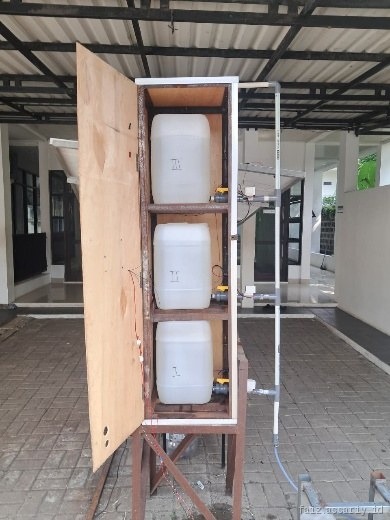
Three 20 L tanks on their own ball valves feeding one PVC manifold, so a tank can be swapped or isolated without stopping the line.
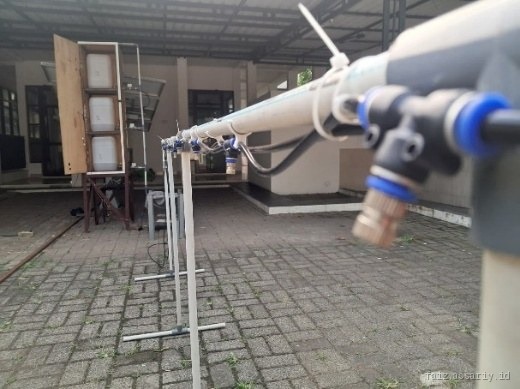
Ten misting nozzles at 32.5 cm spacing on a 3 m PVC boom, run on its own frame before the tanks and valves were plumbed in.
| Metric | Method and conditions | Measured result | Known shortfall and Rev 2 fix |
|---|---|---|---|
| Delivered dose | Two catch tests at the 560 mL cap (Vmax) on water: volume captured over ten cycles, the catchment moved to the next nozzle each cycle, then accumulated in a beaker. | 87.7-91.6% | The error sits in the open-loop hydraulic path, not the arithmetic. Nozzle cleaning moved flow from 12.5 to 12.7 mL/s and the error grew from 8.4% to 12.3%, so FLOW_RATE has to be recalibrated after every cleaning. Rev 2 adds a flow meter and closes the loop. |
| Wi-Fi association range | ESP32 as access point, phone in the station role, walked out along an obstructed path past building canopy and vegetation; distances read from satellite imagery. One spray command sent from the far end. | 50 m | Association was recorded at 50 m but was not stable, and none formed at 65 m. One command was accepted at about -88 dBm. Repeat delivery and packet loss were never measured, so this is not a rated range. |
| Command to valve response | Dashboard payload at severity index 15%, 35% and 80%; tank chosen, applied volume, spray duration and final state read back from the firmware. | Works | All three scenarios clamped to the 180 mL floor, so the volume path was never exercised across canopy sizes. Rev 2 repeats the test with canopies whose target volume clears the floor. |
| Per-nozzle volume | Each of the ten nozzles caught once across ten cycles and summed in a beaker, with the spray cone checked before and after cleaning. | Sum only | The sum is measured, but there is no uniformity analysis across the ten nozzles, so no per-nozzle claim is made. A timed catch per nozzle is the next measurement. |
| Dose across canopy sizes | Scenarios at severity index 15%, 25% and 35% with canopy heights of 64, 80 and 96 cm. | Not exercised | Every target volume landed between 60 and 113 mL, under the 180 mL floor, so the floor set the dose in all three scenarios and canopy geometry never reached the output. The paper calls this the main limitation. Rev 2: lower the floor or widen the dose rate so the geometry term actually moves. |
| Droplet size and drift | Misting nozzles, 0.5 mm orifice, 60 degree cone, reading the manufacturer specification and the observed spray pattern. | 60-120 um, spec only | Droplet size was never measured here, and a share of that band is driftable in wind. Drift loss was not measured either, so no deposition or drift claim is made. |
Figures from the thesis test log, reported in the JASTH paper. The tests ran on water in the laboratory, with no test plants and no pathogen inoculation: this is station-side functional readiness, not closed-loop operation or agronomic efficacy. The dose model was only partly exercised, because every tested canopy clamped to the floor.
What maintenance broke. The line has no inline strainer, so nozzle clogging is a routine fault: a clogged nozzle stops forming its 60° cone. Cleaning it changes the flow rate, which is why the two catches differ. Flow shifted from 12.5 to 12.7 mL/s after cleaning, causing delivered volume to drop from 91.6% to 87.7% of command even though firmware arithmetic was unchanged.
What the tests did not show. Continuous operation for 8 hours was never run; the endurance record is 10 minutes of leak testing and 10 consecutive spray cycles, with the 5 V logic rail holding within 0.25 V of nominal and zero controller resets. Droplet size is manufacturer data (60 to 120 µm), not measured in-field.
What changes in Rev 2. A closed-loop flow meter, an inline strainer so cleaning is not the only maintenance path, a written recalibration routine, and bidirectional command acknowledgements so dropped Wi-Fi frames do not silently skip a plant.
What to test on day one. A full-tank run with an eight-hour soak, three catch tests at the 560 mL cap, and a canopy series whose target volume clears the 180 mL floor to exercise the geometry model.